The World Inequality Lab (WIL) released its annual update of global inequality data.
Tell me in which country you live and I will tell you how much you earn? Maybe that was possible 50 years ago. But the rise of inequality within countries is forcing us to put on new lenses to get a better picture of inequality dynamics. At the WIL, we are constantly working to improve access to data and methods for measuring inequality. In this article, we have selected 3 different lenses to share with you some insights from our 2023 WID update (based on 2022 statistics).
1. The “top 10% income share” lens: Europe, the exception in an unequal world?
Inequality varies significantly between the most equal region (Europe) and the most unequal (Latin America). In 2022, the richest 10% in Europe earned 36% of national income, compared to 58% in Latin America. The Middle East and Africa are just behind Latin America, with a top 10% income share of over 56%.
Click on each region for a look at the latest trends in inequality:
This year, the top 10 most unequal countries (according to their top 10 income share) are all located in Latin America and Sub-Saharan Africa.
- South Africa (65%)
- Central African Republic (65%)
- Mozambique (65%)
- Mexico (65%)
- Namibia (64%)
- Zambia (62%)
- Colombia (61%)
- Swaziland (60%)
- Botswana (59%)
- Costa Rica (58%)
2. The “top 1% income share” lens: no continent is immune to extreme inequality
Other regions of the world come into the picture when we look at how much the richest 1% earn in each country. 8 countries have the top 1% earning more than a quarter of national income.
- Maldives (36%)
- Mozambique (31%)
- Central African Republic (31%)
- Mexico (27%)
- Cambodia (27%)
- Myanmar (27%)
- Angola (26%)
- Peru (25%)
There are also countries in the global North with extreme inequality. In the United States, 19% of national income goes to the richest 1%, the same percentage as in South Africa.
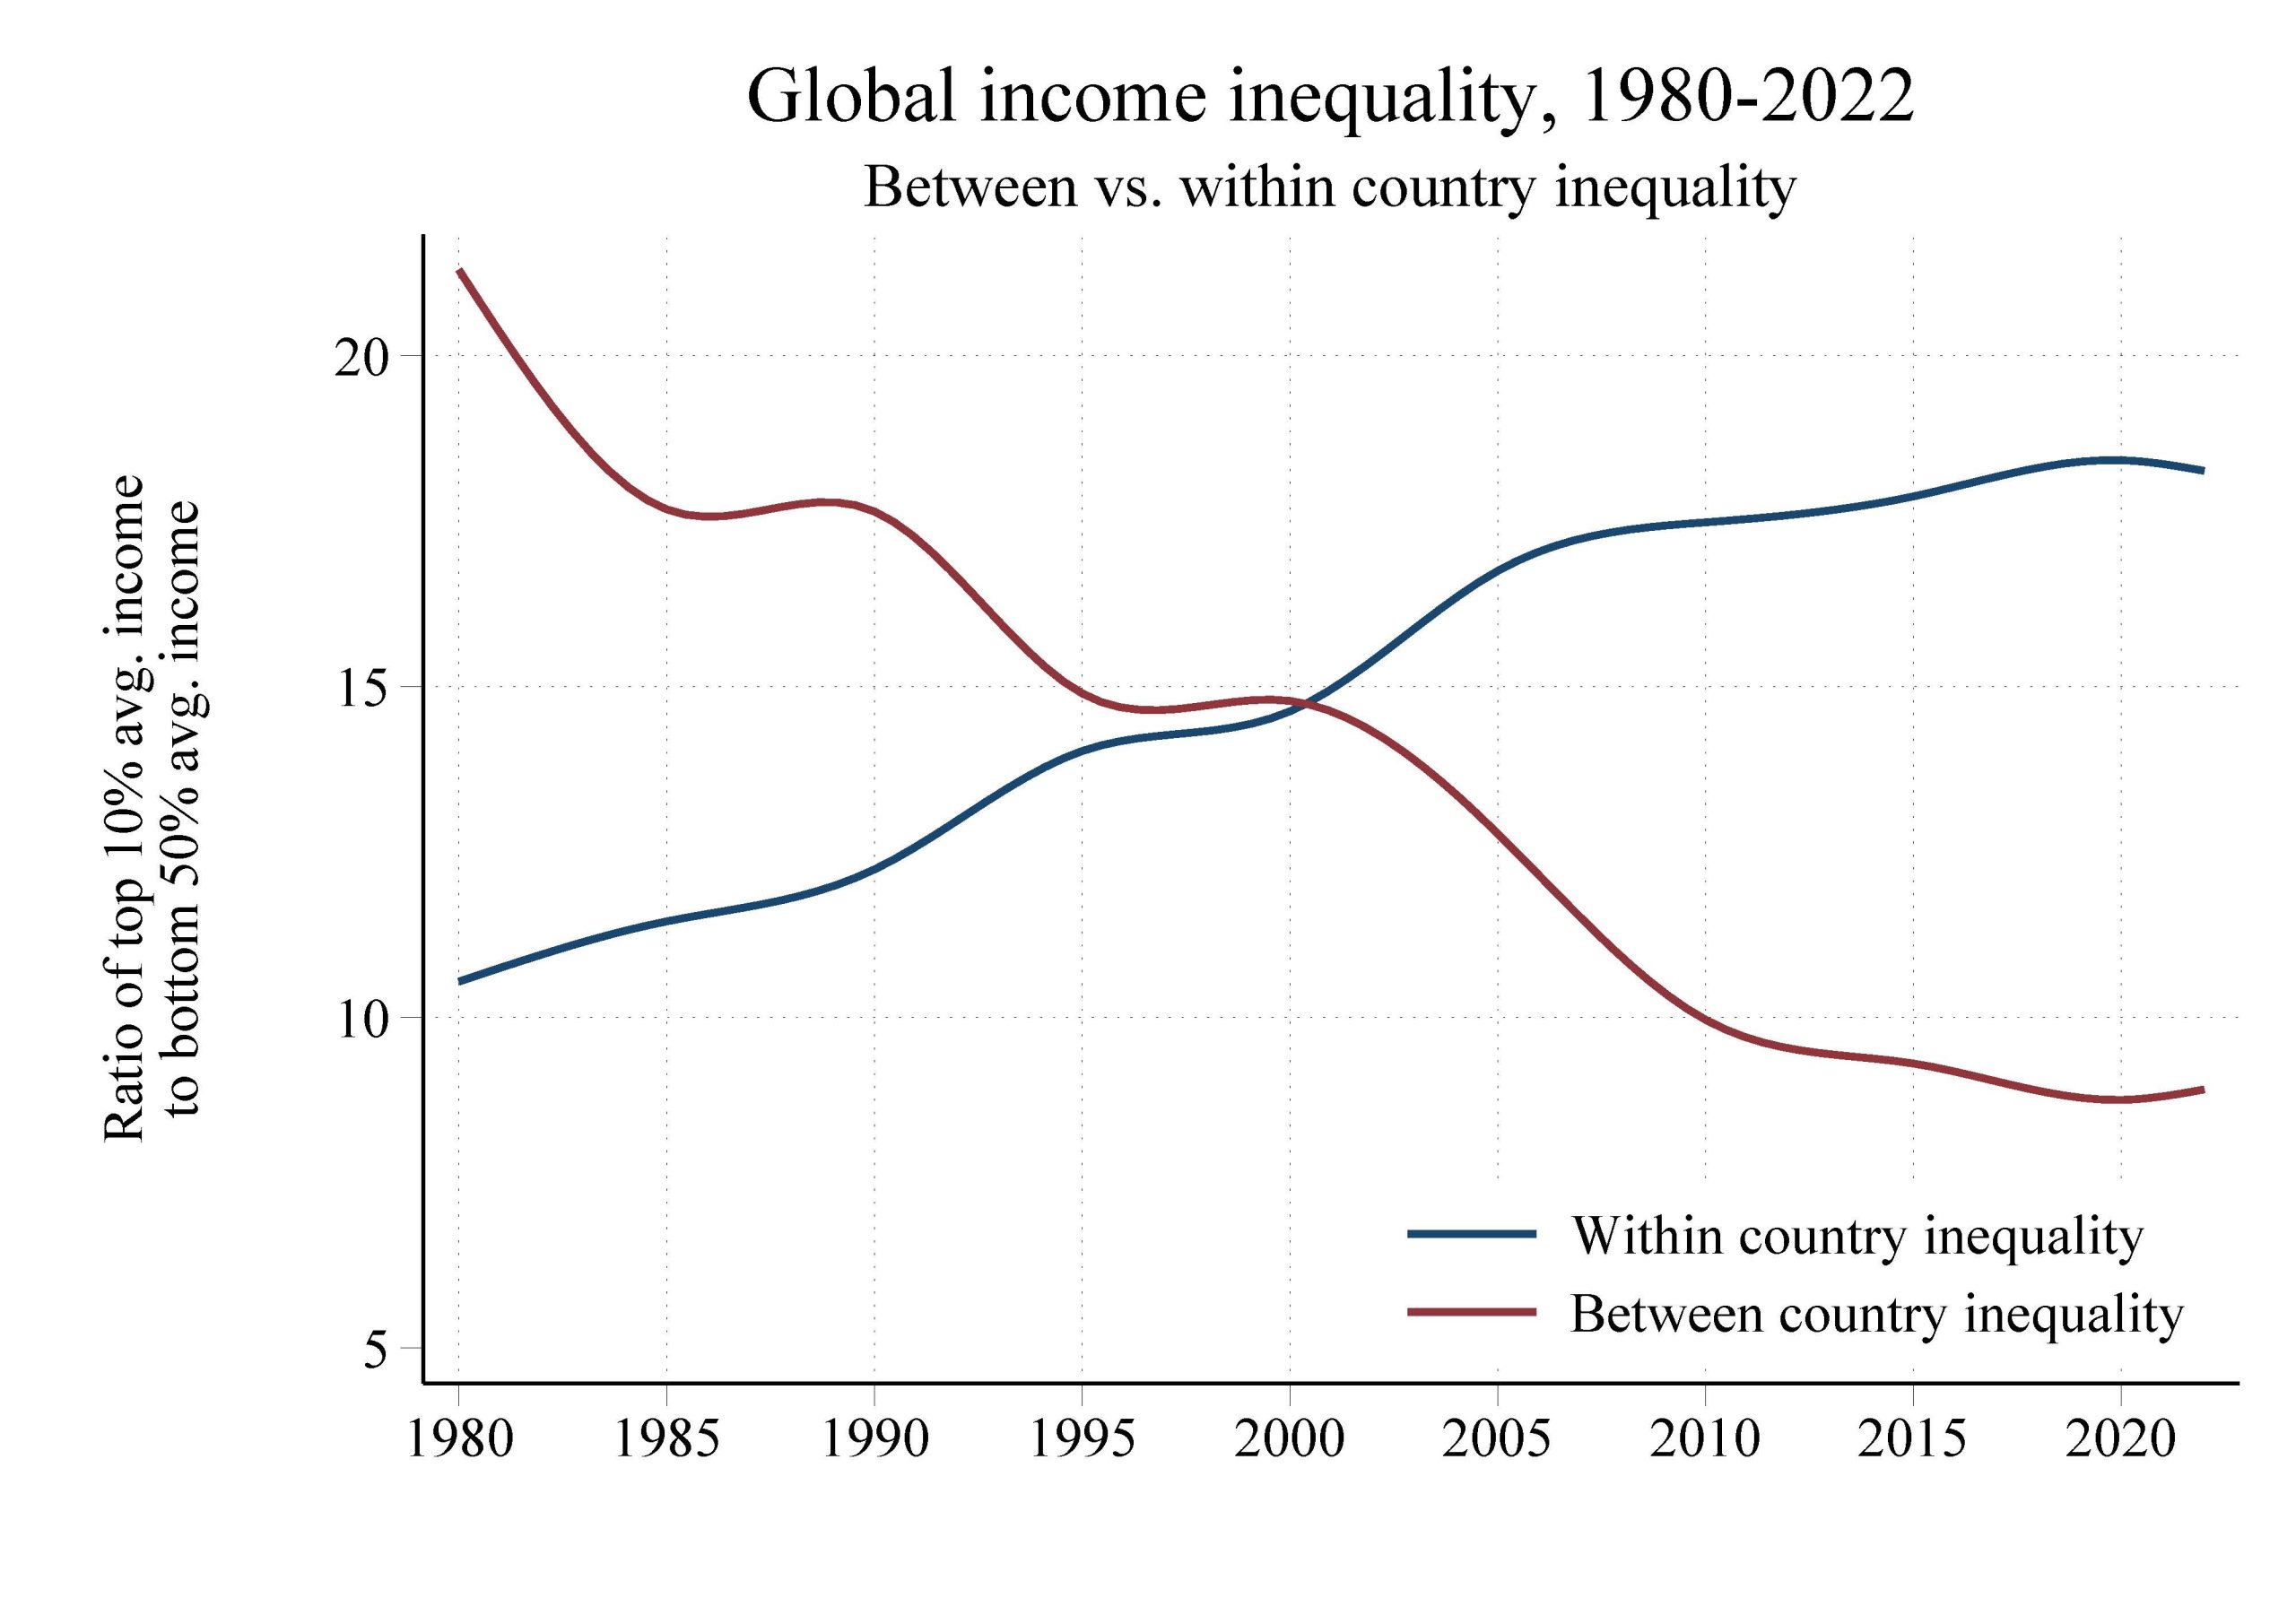
3. The “between versus within country inequality” lens: inequality closer to us
Over the past four decades, global inequality between countries has declined. This has been driven by strong economic growth in China and other emerging economies in Asia. Since 1980, the gap between the average income of the richest 10% of countries and the average income of the poorest 50% of countries has fallen from around 20 times to 9 times.
At the same time, the rapid rise in incomes at the top has increased income inequality within countries. The gap between the average incomes of the top 10% and the bottom 50% of individuals within countries has almost doubled, from 10 to 18 times. This is important because inequalities within countries are more likely to be experienced in our daily lives. This is how we compare with our neighbors, or with our elected representatives, and with society as a whole.
 Recovering from Covid, the average global income rose by 2.5% in 2022, continuing the upward trend of recent decades. This average masks significant disparities between countries. Expressed in terms of purchasing power parity, national income per capita in the United States is 44,023 euros per year, in Europe 29,510 euros per year, in Japan 26,911 euros per year, in China 14,901 euros per year, in Latin America and the Caribbean 10,772 euros per year, and in sub-Saharan Africa 2,751 euros per year.
The pandemic seems to have shifted the diverging trends described above. 2022 saw an increase in inequality between countries for the first time in three decades.
Where to look from here?
 Rowaida Moshrif, WIL’s Head of Data, who coordinated the update process, emphasizes the importance of collaboration in a divided world:
“As we continue to work with researchers and fiscal institutions around the world to improve inequality data and methods, we hope that these findings will serve as a call to action for policymakers, researchers, and global citizens alike.”
Next week, on November 27, we will release new data on global post-tax income inequality, making it possible for the first time to compare pre-tax and post-tax levels of inequality worldwide since 1980. Altogether with this first wave of global pre-tax estimates, we hope this news data will stimulate the debate on inequality and the efficiency and equity of fiscal policy.

- Have you explored the World Inequality Database? Give us feedback on how to improve it at info@wid.world.
- Are you a researcher working on inequality? Do you want to contribute to the WID? Find out more about the WID Fellows.
MEDIA CONTACT
Alice Fauvel, Communications Manager, alice.fauvel@psemail.eu
EXPLORE INEQUALITY TRENDS IN OTHER REGIONS


